We design scalable analytics and visualization solutions that help teams understand business performance and make faster decisions.
We develop automated reporting systems that replace manual spreadsheets and static reports with dynamic, governed analytics.
What you get:
We build interactive dashboards that provide real-time visibility into key business metrics across departments and systems.
What you get:
We move critical business data from legacy platforms to modern solutions, ensuring a seamless data migration process.
What you get:
We build scalable data analytics platforms that transform raw, fragmented data into clear business insights.
What you get:
Our data management team centralizes and governs enterprise data, making it secure, consistent, and ready for business operations, analytics, and AI.
What you get:
We design semantic data models that ensure dashboards and reports are accurate, consistent, and easy to scale.
What you get:
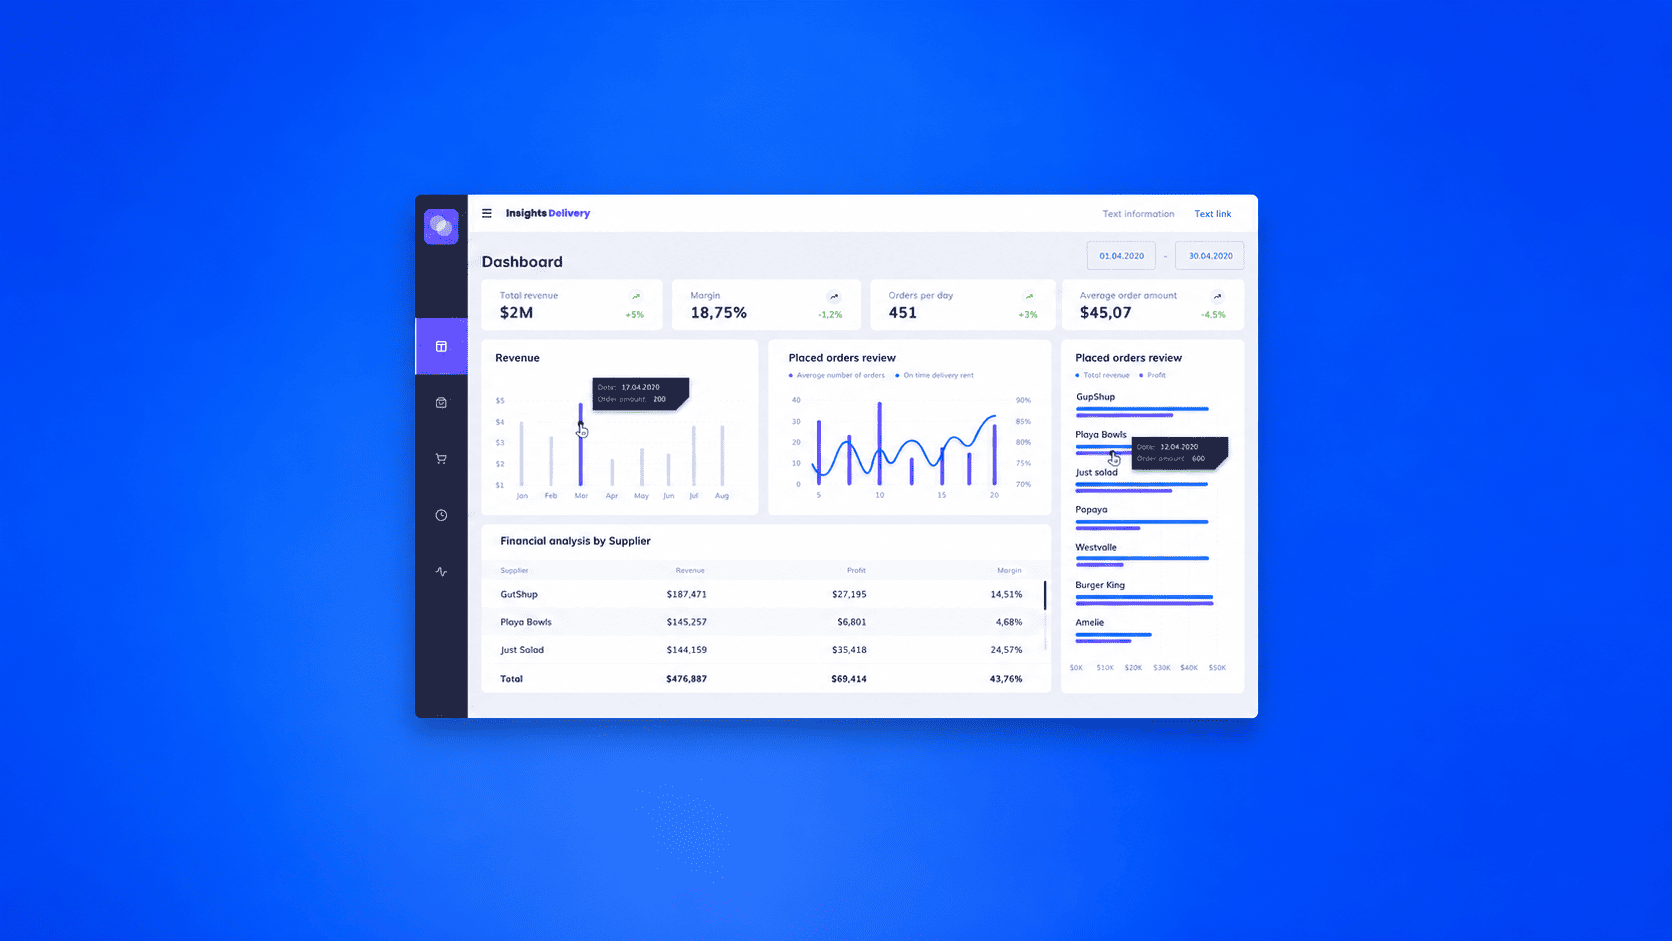
clients achieved a 1.6% increase in average delivery revenue
Akveo developed a reusable Power BI Dashboard Accelerator that helps organizations transform operational and business data into interactive, decision-ready dashboards. By connecting data from ERP systems, CRM platforms, and databases, the solution provides a unified view of key metrics and business performance.
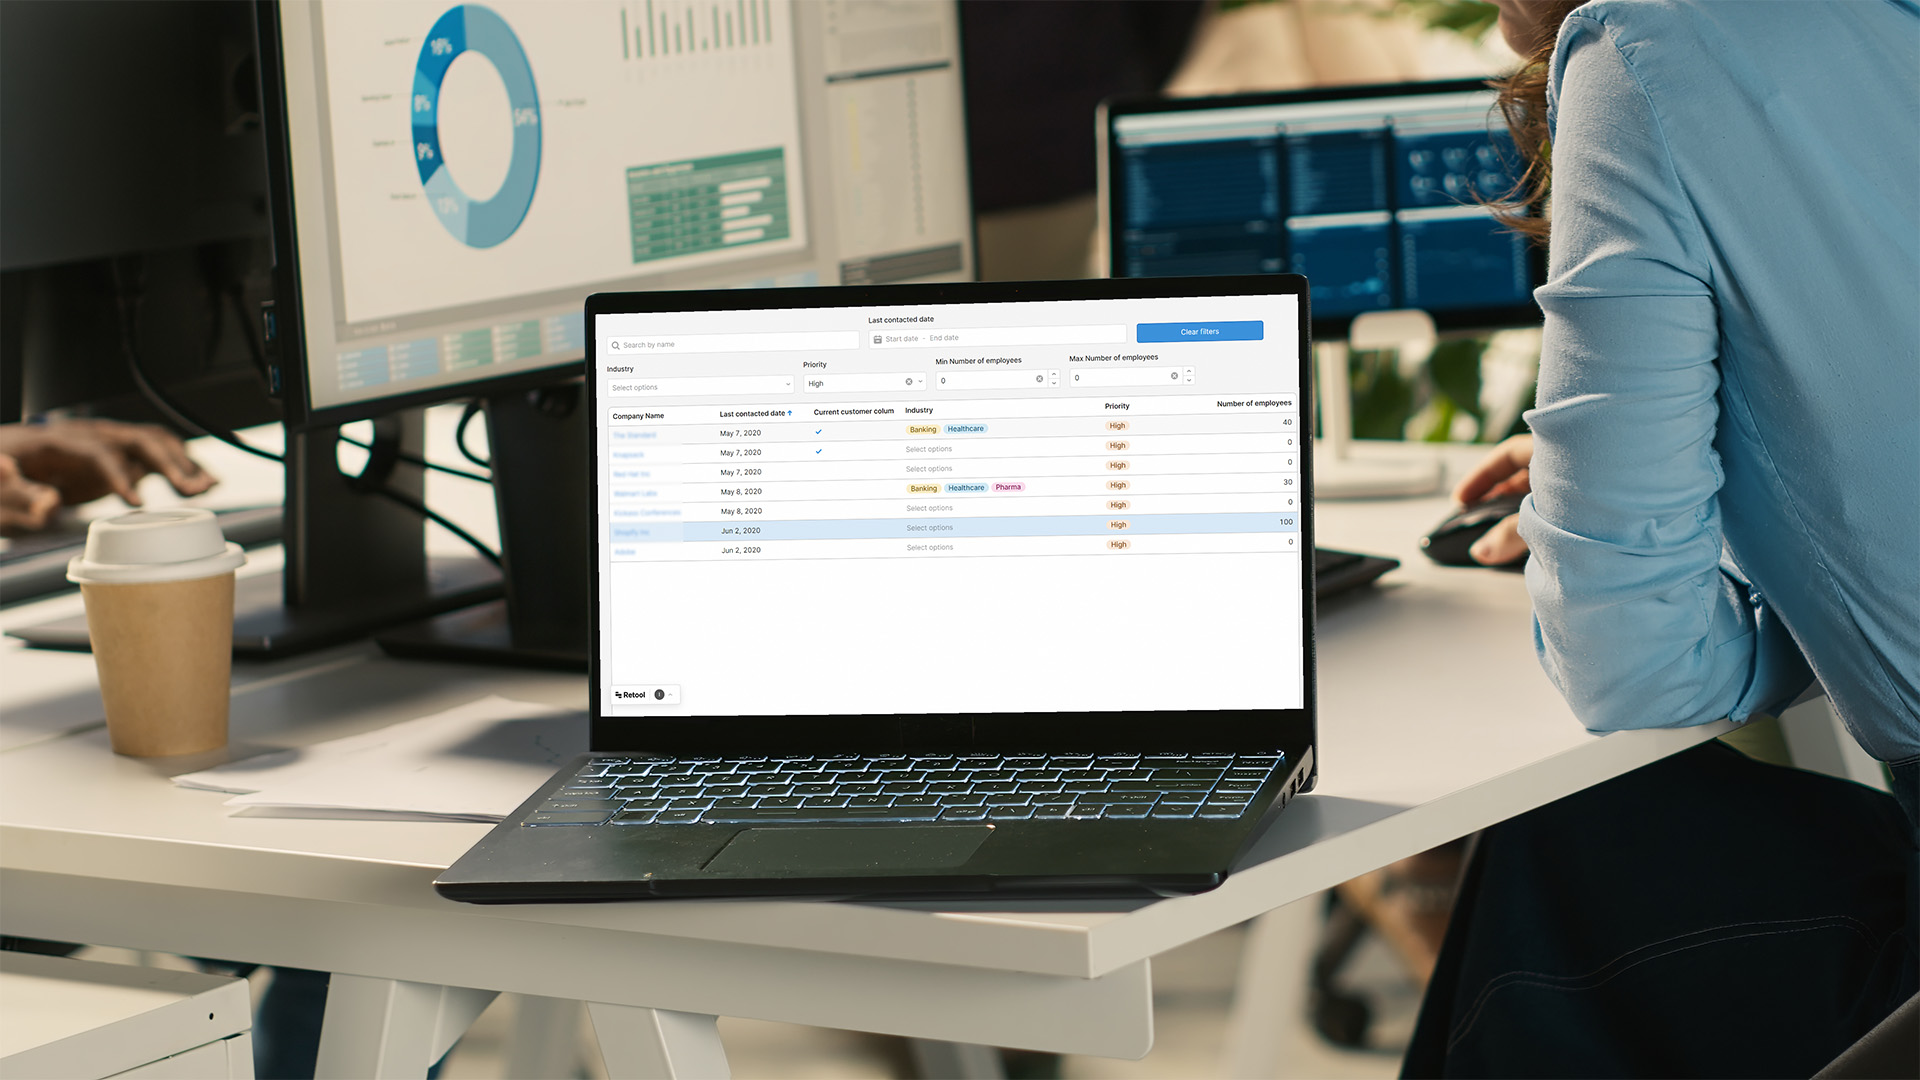
50 hours to fully functional MVP
Akveo developed a custom analytics dashboard that consolidates data from HubSpot, QuickMail, and Clay.com into a single workspace. Interactive visualizations give sales teams real-time visibility into companies, contacts, deals, and outreach activities, helping them monitor pipeline performance and make faster decisions.

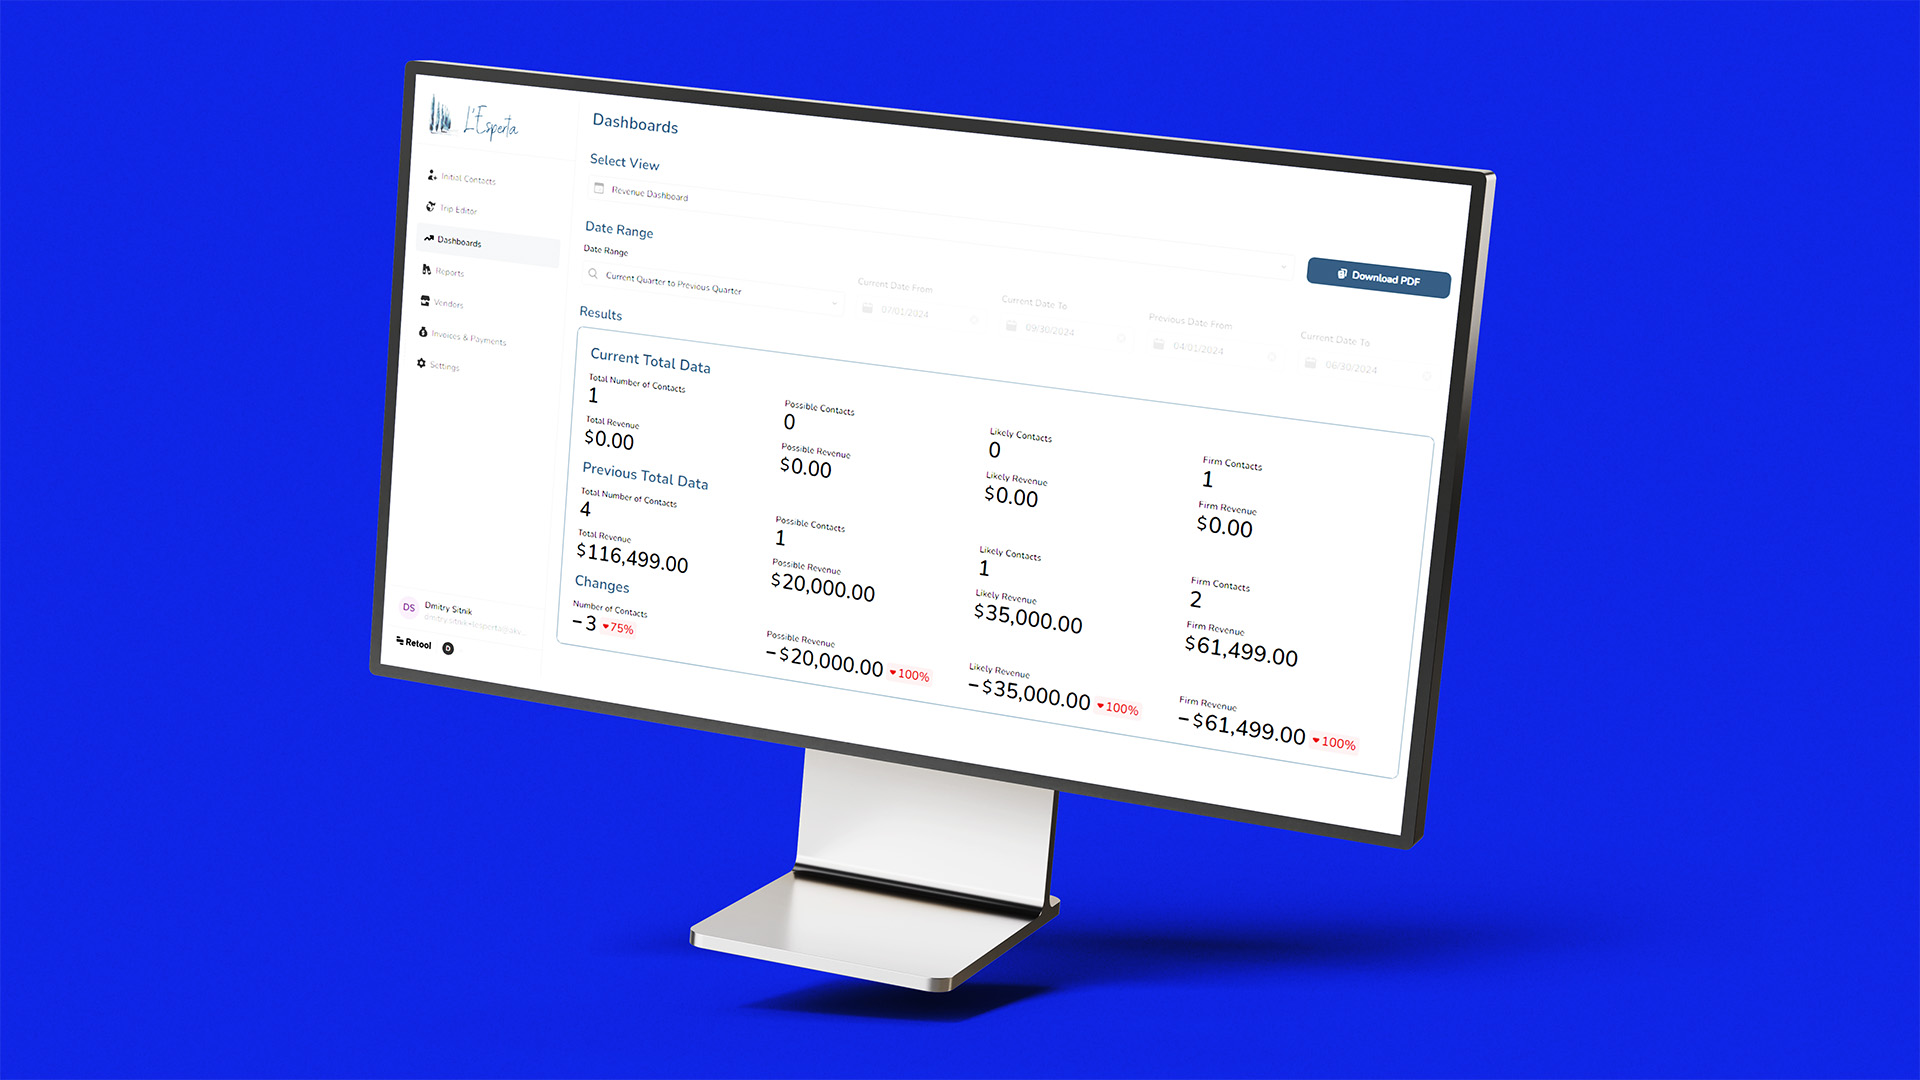
Saved 120+ hours per month through automated reporting
Akveo developed a custom analytics platform that centralizes trip, traveler, and vendor data into a single workspace. Interactive dashboards and automated reports provide real-time visibility into bookings, client activity, and business performance.

We know how to turn complex data into actionable insights that support better business decisions.

We leverage modern BI platforms and proven implementation methodologies to deliver intuitive dashboards and reporting solutions quickly and efficiently.

Benefit from structured project management and transparent communication. You'll always have visibility into milestones, progress, and project outcomes.

Akveo creates interactive dashboards, executive reports, and analytical visualizations that drive meaningful business intelligence.

Whether you're launching a simple reporting tool or expanding enterprise-wide analytics capabilities, we create visualization systems that grow alongside your company.

Every dashboard and report is tailored to your goals, ensuring stakeholders can monitor key metrics.

We implement role-based access controls and security best practices to ensure that business-critical insights remain accessible only to authorized users.
Organizations rely on Akveo to make complex data clear and actionable.


We transform unstructured data into immersive visuals, helping you seamlessly monitor your company goals and business performance.
We build dashboards that visualize operational efficiency and clinical performance across healthcare systems.
Our team creates analytics platforms for claims tracking, risk analysis, and policy performance monitoring.
We design real-time financial dashboards for payments, transactions, and customer analytics.
We visualize sensor data, device performance, and system health for real-time IoT monitoring.
We build learning analytics platforms that track student performance, engagement, and curriculum effectiveness.
Akveo designs comprehensive dashboards for production monitoring, supply chain analytics, and quality control.
Our team builds data visualization and analytics platforms for fleet performance, telematics, and service operations.
We visualize asset performance, energy consumption, grid stability, and operational efficiency.
We use modern BI, analytics, and data engineering technologies to deliver fast, scalable, and interactive visualization solutions.


Collaborate in a way that suits the team structure and project maturity.
Build a dedicated team of data visualization and BI experts that works as an extension of your organization.
Best for: Enterprise reporting systems, AI and digital transformation initiatives.
End-to-end business intelligence delivery. We handle the full cycle of your solution.
Best for: BI implementation, solution modernization.
BI engineers, data analysts, and data visualization experts on demand.
Best for: Fast delivery, skill gaps, scaling analytics teams.
70% of our partners continue working with us for more than 2 years.


Data visualization services transform raw and complex data into interactive dashboards, charts, and reports that help businesses understand performance, trends, and opportunities more easily.
Akveo works with leading BI tools such as Power BI, Tableau, Grafana, and Apache Superset, along with modern data platforms like Snowflake, Databricks, and cloud services from Azure and AWS.
Yes. We design real-time dashboards using streaming data pipelines and analytics tools, enabling instant visibility into operational and business metrics.
Yes. We build self-service analytics platforms that allow business users to explore trusted datasets independently while maintaining governance and data security.
Akveo combines deep expertise in data engineering, BI development, and AI technologies to deliver scalable analytics solutions. We build trusted data foundations that ensure accuracy, performance, and business value.