Introduction
We all love Retool for its speed and simplicity when table data visualization is needed. Just create a query to fetch the required information, select it in the code editor – and drag a new Table component onto the canvas. Voila! Now you have all the data you need, properly formatted and presented to a user.
But what if an application is expected to handle different datasets? Well, you can add several tables, hiding and displaying them conditionally. This approach works if you have a limited number of datasets to display, and if the data is well-structured. Or, at least, its structure doesn’t change with the weather (this is a dad joke we’ve all been waiting for).
A more complex but suitable approach could be the so-called Dynamic Columns in a Table.
Limitations
To be short, Retool dynamic column settings allow you to reconfigure table columns on the fly. When you want to customize columns by changing their labels, value formats, etc., Dynamic Column Settings is the feature that enables you to do so. This works because you can hide columns and change other attributes in addition to mapping new values for column labels and formats. For instance, when the schema of the data source changes it becomes necessary to have these settings.
This feature exists both in the old (legacy) Tables and in the new Table component. This is an important note: implementations differ a lot, so be aware that this guide is focused on the new Table component.
Another important limitation is that Dynamic Columns enabled cuts off deep customization features, like tooltips, and advanced formatting settings. Also, the primary key column couldn’t be a column from the dynamic list. If you are okay with these limitations, let’s go ahead and build an app!
Data to Work With
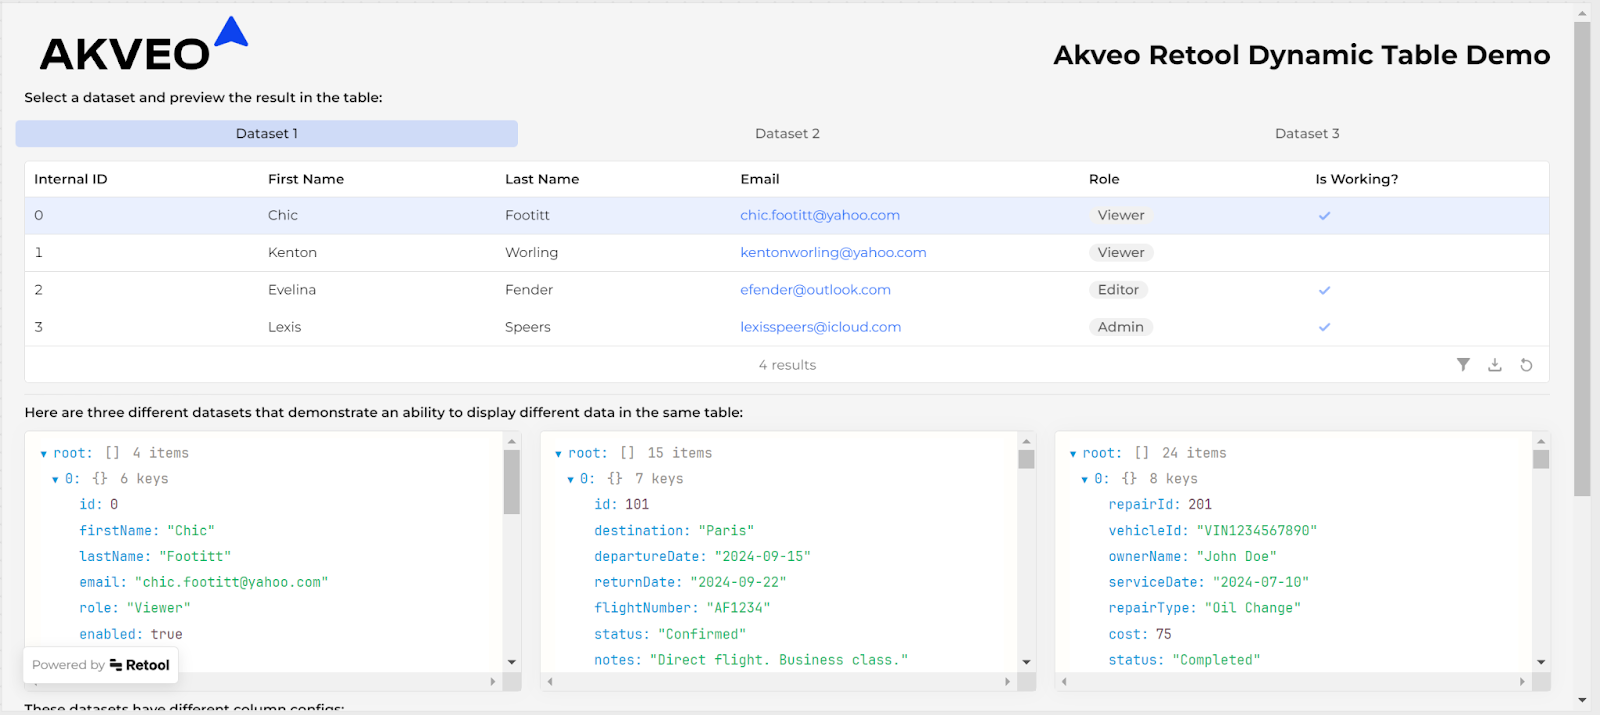
If you like, you can continue reading while exploring our demo app, which is available here.
To demonstrate Dynamic Columns, we prepared three different data structures.
Step 1.
- All the data passed to a table need to be precooked prepared and should look like an array of uniformed objects.
The first one might look familiar to you - it’s based on the Retool demo data displayed in tables by default, it simulates an employee list:
 {
   "id": 0,
   "firstName": "Chic",
   "lastName": "Footitt",
   "email": "chic.footitt@yahoo.com",
   "role": "Viewer",
   "enabled": true
 }
The second one might be borrowed from a travel information system, but maybe not:
 {
   "id": 101,
   "destination": "Paris",
   "departureDate": "2024-09-15",
   "returnDate": "2024-09-22",
   "flightNumber": "AF1234",
   "status": "Confirmed",
   "notes": "Direct flight. Business class."
 }
And finally, the last one mocks up data from a car service:
 {
    "repairId": 201,
    "vehicleId": "VIN1234567890",
    "ownerName": "John Doe",
    "serviceDate": "2024-07-10",
    "repairType": "Oil Change",
    "cost": 75.00,
    "status": "Completed",
    "notes": "Used synthetic oil."
 }
Step 2.
- You can format data using a JavaScript query and then store it in a state variable, or you can format it using a transformer. The idea is to point the table to the one place to get data.

Dynamic Settings
Okay, now we have three data sets with literally nothing in common. How do we handle this? In addition to the data itself, we will prepare different configurations explaining to the table how to handle the data. Each configuration will be an object, where each first-level field represents a key in a dataset, and its child nodes have all the needed data to configure the table.
So, for the employee list, we will have something like this:
 {
   "id": {"name": "Internal ID", "type": "auto", "editable": false},
   "firstName": {"name": "First Name", "type": "string", "editable": false},
   "lastName": {"name": "Last Name", "type": "string", "editable": false},
   "email": {"name": "Email", "type": "link", "editable": false},
   "role": {"name": "Role", "type": "tag", "editable": false},
   "enabled": {"name": "Is Working?", "type": "boolean", "editable": false},
 }
By the way, internal fields like ‘name’, ‘type’, etc. can be named the way you like – it doesn’t matter.
Let’s take a look at the config of the booking dataset. Note that some keys are marked here as editable – yes, dynamic tables support inline editing!
 {
   "id": {"name": "Booking", "type": "auto", "editable": false},
   "destination": {"name": "Destination", "type": "string", "editable": true},
   "departureDate": {"name": "Outbound Flight", "type": "date", "editable": false},
   "returnDate": {"name": "Inbound Flight", "type": "date", "editable": true},
   "flightNumber": {"name": "Flight", "type": "link", "editable": true},
   "status": {"name": "Status", "type": "tag", "editable": false},
   "notes": {"name": "Notes", "type": "string", "editable": true},
 }
And here is the last configuration, of the car repair data. Nothing is new here, but we will try to do some tricks in the table itself:
 {
   "repairId": {"name": "Order Number", "type": "auto", "editable": false},
   "vehicleId": {"name": "Vehicle", "type": "string", "editable": true},
   "ownerName": {"name": "Owner", "type": "avatar", "editable": false},
   "serviceDate": {"name": "Date", "type": "date", "editable": true},
   "repairType": {"name": "Repair", "type": "tag", "editable": true},
   "cost": {"name": "Cost", "type": "currency", "editable": true},
   "status": {"name": "Status", "type": "tag", "editable": true},
   "notes": {"name": "Notes", "type": "string", "editable": true},
 }
Table Configuration
In the demo app, I decided to store the data to display in the tableData variable, while the corresponding configuration is put to the tableConfig variable. When you click on a button on the navigation bar, the values in those variables are replaced with the values from the selected JSON.
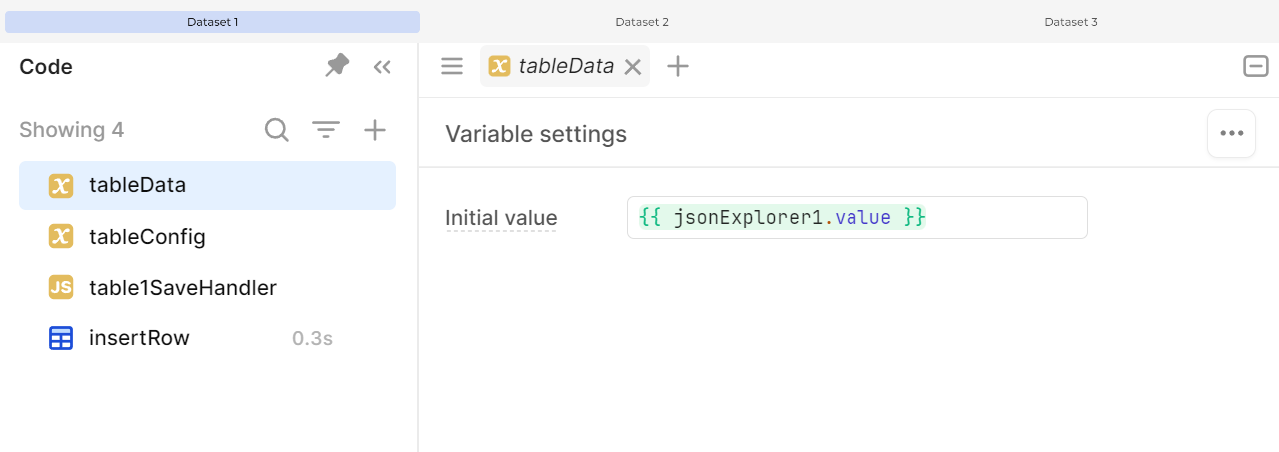
So, if you want to have a fully dynamic table, go and clear all the columns!
Step 3.
- Select the tableData variable as a data source, and then, to make the table programmatically configurable, it shouldn’t have any saved columns, let’s clean them.
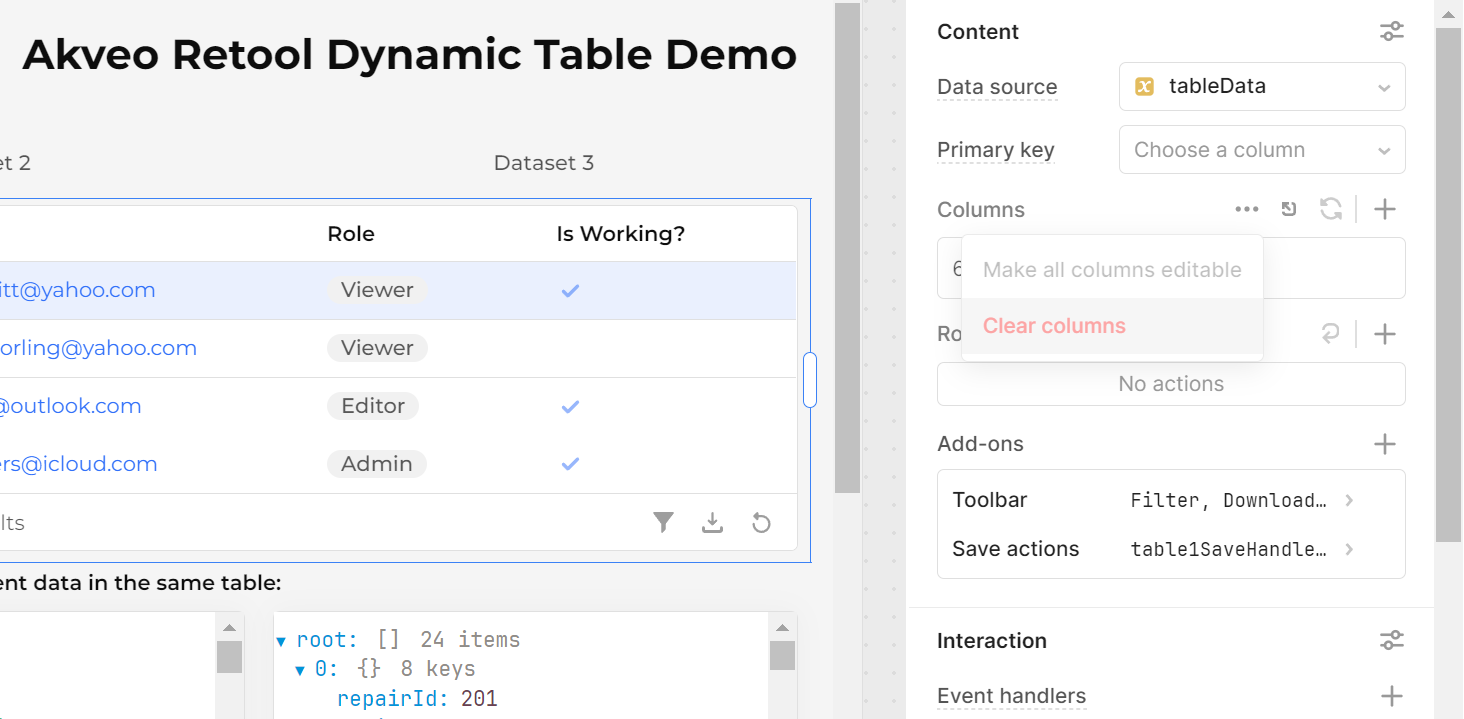
Now we are going to attach dynamic data to the table. The secret button is hidden in the additional menu in the Content part, which is located on the right side of the screen.
Step 4.
- Open the Advanced menu, and check the ‘Use dynamic column settings’ option.
If everything is okay, you will be able to see the table populated with the data you have. However, it won’t display column names, etc.
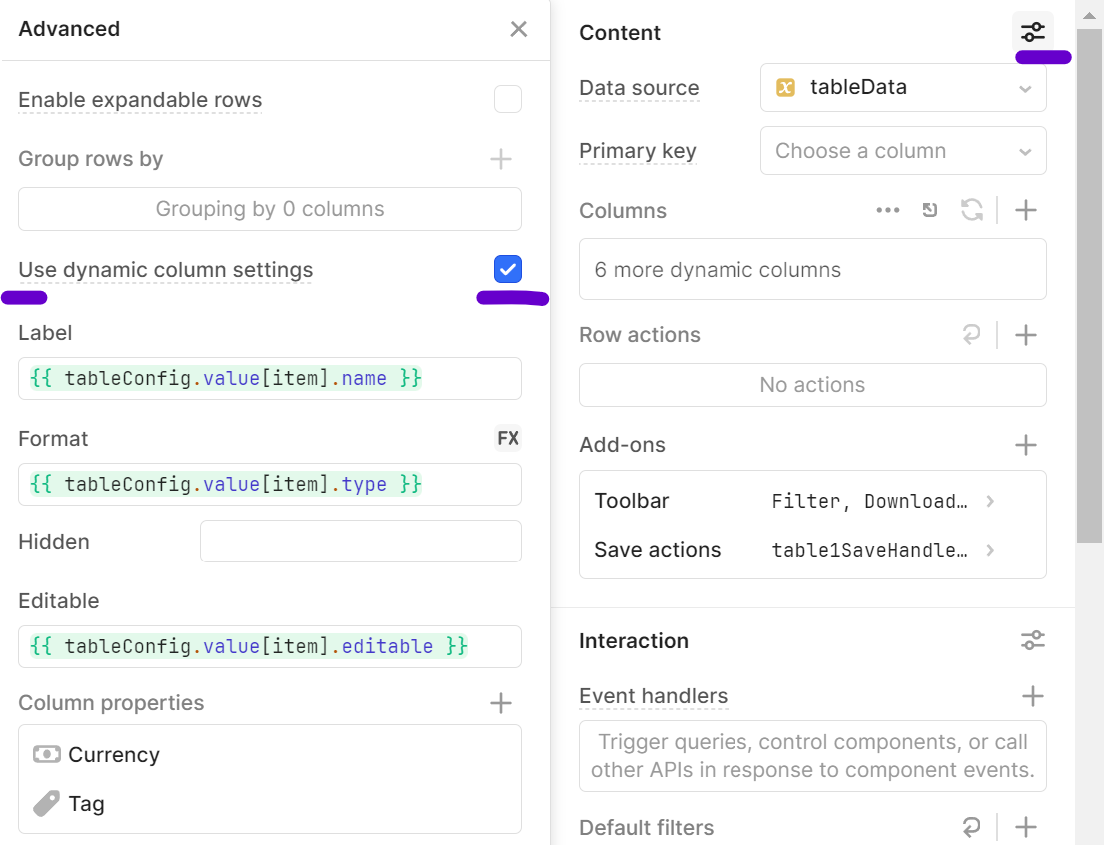
Now, let’s attach the configuration to the table. To understand, which key is being used at the moment, we can refer to an ‘item’ alias. It returns the current column key that table is rendering. So, let’s get the correct labels, formats, and edit attributes set.
Step 5.
- Refer to the configuration variable using the ‘item’ alias in the fields needed, don’t forget to click on a small FX button, if you want to control the format settings programmatically, too (enabled in our example).
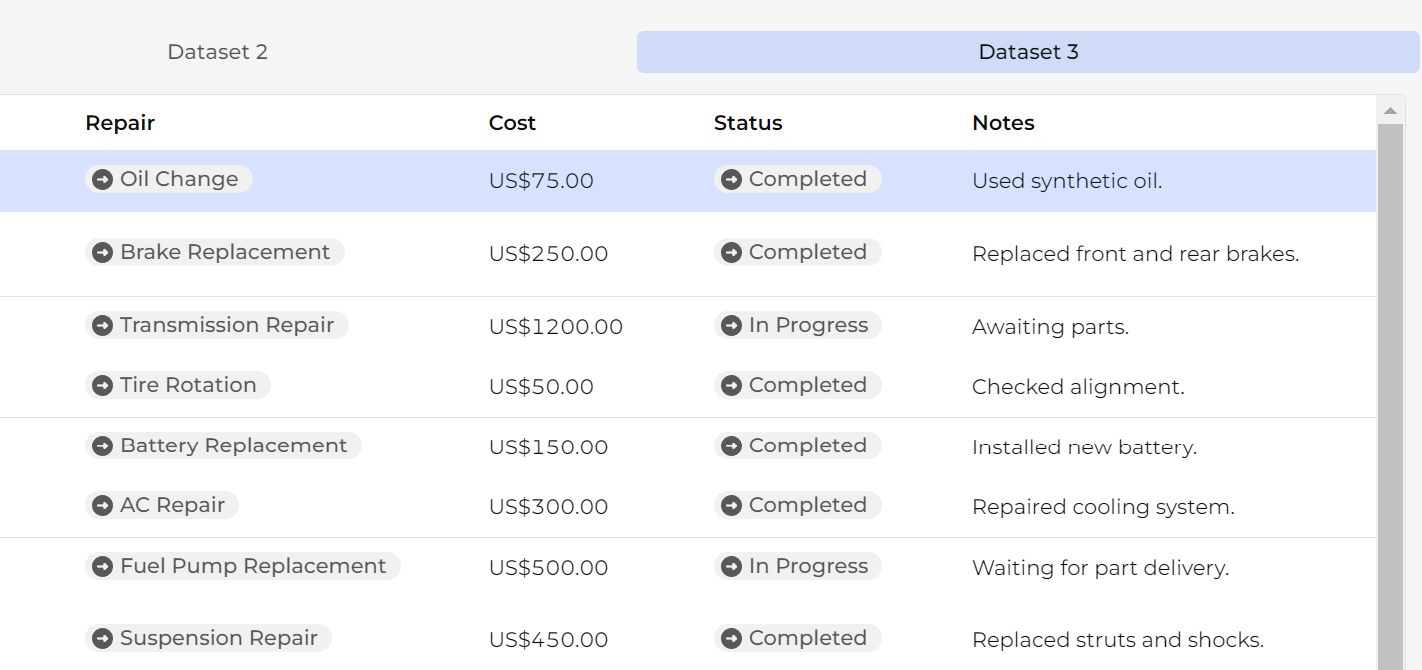
On the lowest part of the Advanced panel, you can see a Column Properties section. It allows you to configure type-specific parameters. For example, for currency I specified the currency code ‘USD’, so when a currency column appears on the table, it is formatted as US Dollars.
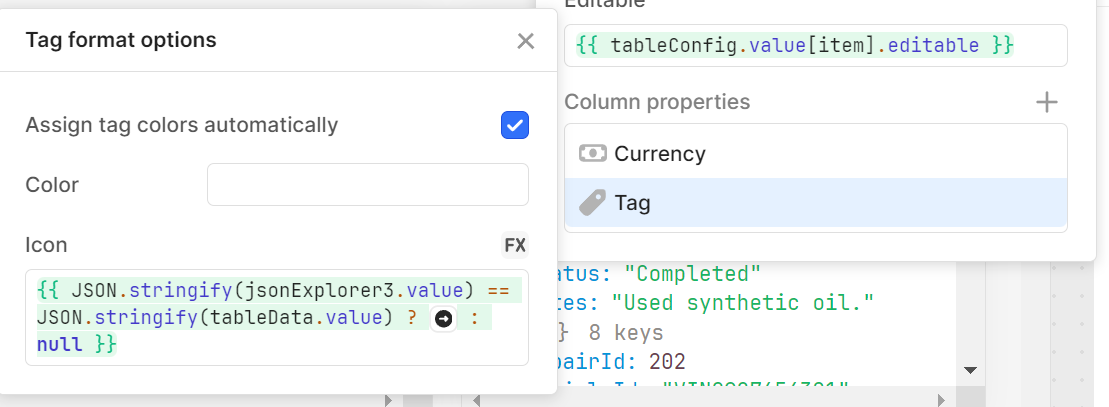
The ‘tag’ example is more interesting, in my opinion. For demo purposes, we add an icon to all the tags that are displayed in the table, if the data comes from the third, ‘car service’, dataset.
Of course, you can invent another logic here – and make the table display different icons at all.
Step 6.
- Configure type-specific options, like special currency formats, icons, colors, and so on.
The End
If you have followed this guide, you should be able to see a working dynamic table. And we are happy for you! To say, our team struggled a lot when we faced a need to use dynamic tables. We hope that this exploration will be a way easier for you thanks to this article. If you have any additional questions, please feel free to reach me – or any other Akveo Team member. And good luck!
Streamlining Gifting Marketplace Operations with Retool
Afloat, a gifting marketplace, needed custom dashboards to streamline order management, delivery tracking, and reporting while integrating with Shopify and external APIs.
The solution:
We built two Retool-based dashboards:
- A Retail Partner Dashboard embedded into Shopify for managing orders and store performance.
- An Admin Dashboard for handling deliveries and partner data.
Both dashboards included real-time integration with Afloat's Backend and APIs for accurate, up-to-date data and scalability.
The result: enhanced efficiency, error-free real-time data, and scalable dashboards for high-order volumes.
Billing Automation for a SaaS Company with Low-Code
Our client needed a robust billing solution to manage hierarchical licenses, ensure compliance, and automate invoicing for streamlined operations.
The solution:
We developed a Retool-based application that supports multi-tiered licenses, automates invoicing workflows, and integrates seamlessly with CRM and accounting platforms to enhance financial data management.
The result:
- Achieved 100% adherence to licensing agreements, mitigating penalties.
- Automated invoicing and workflows reduced manual effort significantly.
- Dashboards and reports improved decision-making and operational visibility.
Retool Dashboards with HubSpot Integration
Our client needed a centralized tool to aggregate account and contact activity, improving visibility and decision-making for the sales team.
The solution
We built a Retool application integrated with HubSpot, QuickMail, and Clay.com. The app features dashboards for sorting, filtering, and detailed views of companies, contacts, and deals, along with real-time notifications and bidirectional data syncing.
The result
- MVP in 50 hours: Delivered a functional application in just 50 hours.
- Smarter decisions: Enabled data-driven insights for strategic planning.
- Streamlined operations: Reduced manual tasks with automation and real-time updates.
Lead Generation Tool to Reduce Manual Work
Our client, Afore Capital, a venture capital firm focused on pre-seed investments, aimed to automate their lead generation processes but struggled with existing out-of-the-box solutions. To tackle this challenge, they sought assistance from our team of Akveo Retool experts.
The scope of work
The client needed a tailored solution to log and track inbound deals effectively. They required an application that could facilitate the addition, viewing, and editing of company and founder information, ensuring data integrity and preventing duplicates. Additionally, Afore Capital aimed to integrate external tools like PhantomBuster and LinkedIn to streamline data collection.
The result
By developing a custom Retool application, we streamlined the lead generation process, significantly reducing manual data entry. The application enabled employees to manage inbound deals efficiently while automated workflows for email parsing, notifications, and dynamic reporting enhanced operational efficiency. This allowed Afore Capital's team to focus more on building relationships with potential founders rather than on administrative tasks.
Retool CMS Application for EdTech Startup
Our client, CutTime, a leading fine arts education management platform, needed a scalable CMS application to improve vendor product management and user experience.
The scope of work
We developed a Retool application that allows vendors to easily upload and manage product listings, handle inventory, and set shipping options. The challenge was to integrate the app with the client’s system, enabling smooth authentication and product management for program directors.
The result
Our solution streamlined product management, reducing manual work for vendors, and significantly improving operational efficiency.
Building Reconciliation Tool for e-commerce company
Our client was in need of streamlining and simplifying its monthly accounting reconciliation process – preferably automatically. But with a lack of time and low budget for a custom build, development of a comprehensive software wasn’t in the picture. After going through the case and customer’s needs, we decided to implement Retool. And that was the right choice.
The scope of work
Our team developed a custom reconciliation tool designed specifically for the needs of high-volume transaction environments. It automated the processes and provided a comprehensive dashboard for monitoring discrepancies and anomalies in real-time.
The implementation of Retool significantly reduced manual effort, as well as fostered a more efficient and time-saving reconciliation process.
Creating Retool Mobile App for a Wine Seller
A leading spirits and wine seller in Europe required the development of an internal mobile app for private client managers and administrators. The project was supposed to be done in 1,5 months. Considering urgency and the scope of work, our developers decided to use Retool for swift and effective development.
The scope of work
Our developers built a mobile application tailored to the needs of the company's sales force: with a comprehensive overview of client interactions, facilitated order processing, and enabled access to sales history and performance metrics. It was user-friendly, with real-time updates, seamlessly integrated with existing customer databases.
The result? Increase in productivity of the sales team and improved decision-making process. But most importantly, positive feedback from the customers themselves.
Developing PoC with Low Code for a Tour Operator
To efficiently gather, centralize, and manage data is a challenge for any tour operator. Our client was not an exception. The company was seeking to get an internal software that will source information from third-party APIs and automate the travel itinerary creation process. Preferably, cost- and user-friendly tool.
The scope of work
Our experts ensured the client that all the requirements could be covered by Retool. And just in 40 hours a new software was launched. The tool had a flexible and easy-to-use interface with user authentication and an access management system panel – all the company needed. At the end, Retool was considered the main tool to replace the existing system.
Testing New Generation of Lead Management Tool with Retool
Our client, a venture fund, had challenges with managing lead generation and client acquisition. As the company grew, it aimed to attract more clients and scale faster, as well as automate the processes to save time, improve efficiency and minimize human error. The idea was to craft an internal lead generation tool that will cover all the needs. We’ve agreed that Retool will be a perfect tool for this.
The scope of work
The project initially began as a proof of concept, but soon enough, with each new feature delivered, the company experienced increased engagement and value.
We developed a web tool that integrates seamlessly with Phantombuster for data extraction and LinkedIn for social outreach. Now, the company has a platform that elevates the efficiency of their lead generation activities and provides deep insights into potential client bases.
Building an Advanced Admin Portal for Streamlined Operations
Confronted with the need for more sophisticated internal tools, an owner of IP Licensing marketplace turned to Retool to utilize its administrative functions. The primary goal was to construct an advanced admin portal that could support complex, multi-layered processes efficiently.
The scope of work
Our client needed help with updating filters and tables for its internal platform. In just 30 hours we've been able to update and create about 6 pages. Following features were introduced: add complex filtering and search, delete records, styling application with custom CSS.
Together, we have increased performance on most heavy pages and fixed circular dependency issues.
Creating MVP Dashboard for Google Cloud Users
Facing the challenge of unoptimized cloud resource management, a technology firm working with Google Cloud users was looking for a solution to make its operations more efficient. The main idea of the project was to create an MVP for e-commerce shops to test some client hypotheses. Traditional cloud management tools fell short.
The scope of work
Determined to break through limitations, our team of developers turned Retool. We decided to craft an MVP Dashboard specifically for Google Cloud users. This wasn't just about bringing data into view; but about reshaping how teams interact with their cloud environment.
We designed a dashboard that turned complex cloud data into a clear, strategic asset thanks to comprehensive analytics, tailored metrics, and an intuitive interface, that Retool provides. As the results, an increase in operational efficiency, significant improvement in cost management and resource optimization.
Elevating CRM with Custom HubSpot Sales Dashboard
Our other client, a SaaS startup, that offers collaborative tools for design and engineering teams, was on a quest to supercharge their sales efforts. Traditional CRM systems were limited and not customizable enough. The company sought a solution that could tailor HubSpot to their workflow and analytics needs.
The scope of work
Charged with the task of going beyond standard CRM functions, our team turned to Retool. We wanted to redefine how sales teams interact with their CRM.
By integrating advanced analytics, custom metrics, and a user-friendly interface, our developers provided a solution that transformed data into a strategic asset.
In 40 hours, three informative dashboards were developed, containing the most sensitive data related to sales activities. These dashboards enable our customer to analyze sales and lead generation performance from a different perspective and establish the appropriate KPIs.
Building a PDF Editor with Low-Code
Our client, a leading digital credential IT startup, needed a lot of internal processes to be optimized. But the experience with low-code tools wasn’t sufficient. That’s why the company decided to hire professionals. And our team of developers joined the project.
The scope of work
The client has a program that designs and prints custom badges for customers. The badges need to be “mail-merged” with a person’s info and turned into a PDF to print. But what is the best way to do it?
Our developers decided to use Retool as a core tool. Using custom components and JavaScript, we developed a program that reduced employees' time for designing, putting the data, verifying, and printing PDF badges in one application.
As a result, the new approach significantly reduces the time required by the internal team to organize all the necessary staff for the conference, including badge creation.


