Here is a Power BI dashboard template designed specifically for delivery management activities that highlight the template's possibilities. You can integrate it into your business domain or let us do it for you. Сonsolidate your data in one place, carefully measure every step and earn customer loyalty.
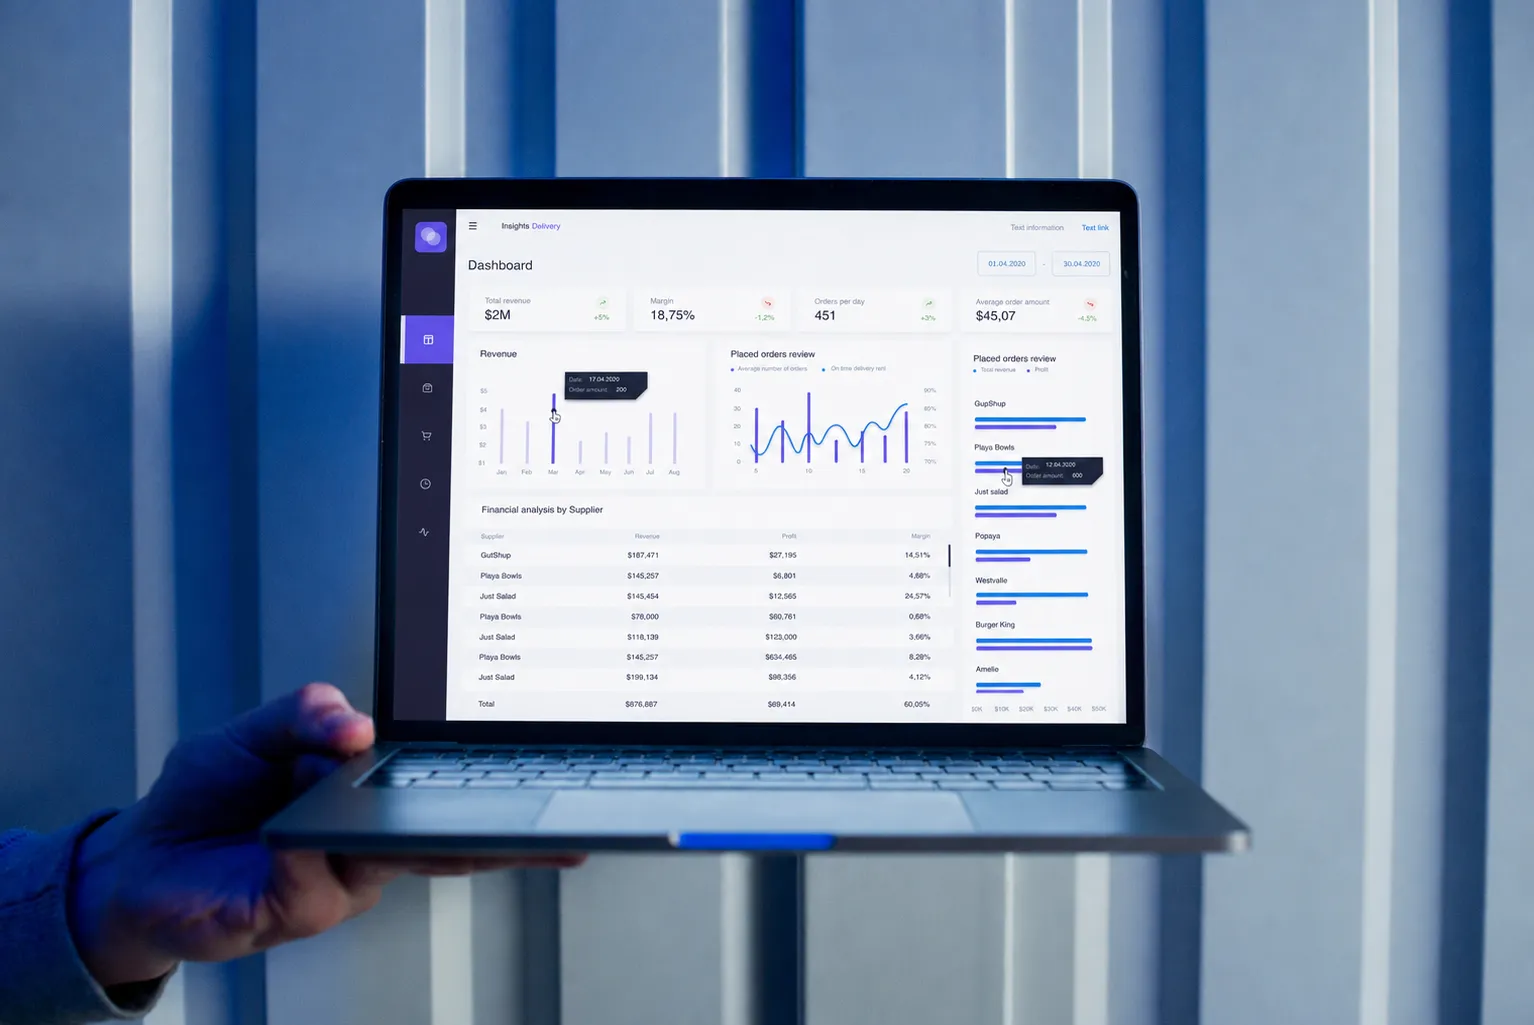
Have an upper hand over competitors with faster implementation of the Power BI templates. Akveo delivery software improves your tracking analytics while saving development time.
Based on Microsoft PowerBI technology, we have built a delivery template that may easily be customized according to various business needs. The power BI template covers integral areas of a delivery business: orders analysis, delivery efficiency, supply chain management, and financial results.
Using this template, you will create an app that introduces efficient orders processing in no time.
The summary page allows you to understand the distribution of orders based on the day of the week (time of the day) and gives you a quick overview of what’s going on in your delivery operations. The page provides the most important KPIs: revenue, margin, average check and aggregates financial analysis by supplier and time delivery rate.
These sections contain KPIs and visual elements that help to analyze how efficient the delivery process is in your company.
At these dashboards you'll find answers to all these questions.
The dashboard aggregates the most important values of financial activities: profit and margin analyzed across suppliers. This page helps to count expenses and losses and make the right decisions on how to ensure further business growth.
The showcase demonstrates the capabilities of the application for a food delivery company. However, Insights Delivery can be applied by various delivery companies with different business models. A cloud database serves as a backbone of the solution and offers a solid ground for analytical tasks. The database can handle data from various sources - be it large ERP systems, web applications, or regular Excel files.

All delivery KPIs in one place.

Orders and couriers management.

Financial analytics: profit and margin across suppliers.
The COVID-19 pandemic has affected nearly all industries across the globe. However, some businesses have managed to find hidden opportunities to grow despite the global lockdown. While most companies are having a hard time dealing with virus-related challenges, the delivery business has got a serious boost. Let’s find out how it’s become possible.
Business results:
Business needs:
The client operates a cargo delivery and taxi service in cooperation with companies in the Genoa region, Italy. The client wanted to have an online dashboard with displayed deliveries and the possibility to visualize reports. Following the lockdown, the business became public and started to cooperate with restaurants, mainly for food delivery. The client wanted to find out in what regions restaurants delivery service should be improved.
The business goal was to speed up deliveries processing and allow tracking more than 1000+ deliveries simultaneously. Also, it was vital to report deliveries stats and export revenue reports from the dashboard.
The existing dashboard app has been in development during the last 5 years by the company’s internal team and freelancers. Monthly costs to support the app and fix bugs reached 500-800$ per month.
When the delivery traffic had increased because of COVID-19, the system proved its inefficiency during peak days. The business owners realized that the scalability of the current app would be a bottleneck for business operations in the next 6-9 months.
Solution:
Our team used free of charge Akveo products: ngx-admin and the Delivery Insights template as a basis for the new application. The idea was to use pre-developed features in the template and add required charts for the following use cases:
Akveo initiated a 1-week discovery phase to elicit requirements and business context. With the requirements specification in place, we started with the PowerBI setup for the existing deliveries data. In parallel, our front-end developer developed a web application for the dashboard in 2 weeks. Then, Power BI reports were embedded in the dashboard application.
During the following month, the project team optimized reports and added required charts to cover specific needs. It’s worth noting that the Akveo team communicated with the client regularly to apply changes based on the client’s feedback.
The period of stabilization and acceptance took 16 days. As a result, the final version of the application was developed in 61 days counting from the kick-off meeting with the project team. After 3 months of guarantee usage, there were 4 issues reported and 7 change requests for new features applied.
Contact our team and discover what benefits the Delivery Insights template has in store for your business!
95 % unserer Kunden setzen die Zusammenarbeit nach dem ersten Projekt fort, und mehr als 70 % arbeiten seit über zwei Jahren mit uns zusammen.